Reviewers
We gratefully acknowledge the contributions of everybody who has reviewed the Matched Methodology.
- npower
- Good Energy
- So Energy
- Iain Staffell, Imperial College London
- Robin Morris, Zero Institute, University of Oxford
- Wilson Ricks, Princeton University
- Matthew Brander, Business School, University of Edinburgh
- Tom Luff, Energy Systems Catapult
- Killian Daly, EnergyTag
- Benedict Shegog, Seb Porter, Charles Checkley, Granular Energy
- Olivier Corradi, ElectricityMaps
- Connor Galbraith, Clement Attwood, Dylan Johnson, Future Energy Associates
- Louise Dalton, Stella Mavrommati, CMS
- Liam O’Flynn, Freeths
- Giorgio Balestrieri, Robert Richardson, Tesla
- Adrien Lebrun, ALL Energy
- Alan Tarleton, EcoAct
- Chris Page, Energy Context
- Peter Dudfield, Open Climate Fix
- Puneeth Kalavase, Plus Power
- Rohan Ma, Redwood Materials
- Ayrton Bourn, Dare
- Amit Gudka, Field
Not all contributors can necessarily endorse all aspects of methodology.
Executive Summary
About Matched
Matched is an independent, open-source organisation. We use public data to track renewable supply on a half-hourly basis. We collaborate with retailers to establish verifiable benchmarks for half-hourly matching scores, and partner with consumer organisations to educate customers on the topic.
Matched is founded by Joe Kwiatkowski, PhD. Joe has worked in the energy industry in California and the UK for over a decade, including a long stint as a senior member of Tesla’s energy and battery division.
Methodology Overview
This document presents a methodology for calculating temporal matching between renewable energy supply and demand in the UK electricity market. Using newly available public data sources, we calculate half-hourly matching scores for the portfolios of UK energy retailers. We show that there are significant gaps between annualised certificate matching claims and actual temporal delivery and that, even amongst retailers branded '100% renewable', there can be big differences in the renewable content of power delivered.
For a more accessible introduction to this methodology, see our blog post explainer.
Future versions of this methodology will add matching against nuclear supply.
Key Results
Analysis of 15 major UK energy retailers shows that half-hourly matching scores range from 11% to 89%.
Core Position
The current annual volumetric matching system, while more valuable in renewable energy's early stages, now masks significant temporal mismatches between renewable generation and demand. This temporal disconnect undermines the physical integrity of renewable claims, distorts market signals for renewable investment, and prevents consumers from understanding the true environmental impact of their electricity demand.
We propose that a half-hourly extension of the Renewable Energy Guarantees of Origin (REGO) system represents the most pragmatic advancement for temporal renewable energy matching in the UK market. Building on existing infrastructure while adding temporal granularity provides an evolutionary path that balances ambition with practical implementation.
Primary Recommendation
We invite retailers to adopt half-hourly matching score disclosure as standard practice. Voluntary adoption would demonstrate leadership, build consumer trust in renewable energy claims, and catalyze regulatory evolution.
We invite retailers to work with Matched to validate this methodology on internal data sources. The 2025 Clean Power Index was published on October 27th and is available at matched.energy/clean-power-index.
Introduction
Problem Statement
Current UK renewable energy matching relies on an annualised volumetric approach whereby renewable energy certificate volumes and demand are compared to each other at an annual aggregate level, regardless of when generation actually occurred. This allows retailers to claim 100% renewable electricity while their customers consume fossil-fuel generated power during periods of low renewable output.
This temporal mismatch undermines the physical integrity of renewable claims, distorts market signals for renewable investment, and prevents consumers from understanding the true environmental impact of their electricity demand.
A subset of retailers have made the commendable decision to offer monthly or half-hourly matching scores to consumers.
Limitations of Current Volumetric Approaches
Volumetric matching creates several critical limitations that undermine the integrity and effectiveness of renewable energy procurement:
- Temporal Misalignment: Annual or monthly certificate matching ignores the fundamental physical constraint that electricity must be generated and consumed simultaneously. A retailer can purchase REGOs from summer solar generation to cover winter evening demand, despite no solar generation occurring during peak demand periods.
- Market Signal Distortion: By allowing temporal arbitrage, volumetric matching fails to incentivise investment in renewable generation capacity that aligns with demand patterns, particularly during periods of high demand and low renewable output.
- Information Asymmetry: Energy buyers (either corporate or residential) typically lack visibility into when their renewable energy was actually generated, preventing informed procurement decisions that could drive system-wide decarbonization.
- Grid Balancing Costs: The mismatch between certificate-backed claims and physical reality obscures the true costs and challenges of grid balancing, potentially delaying necessary investments in renewable baseload, storage and demand flexibility.
Scope and Objectives
This methodology specifically addresses grid-connected renewable energy matching for licensed UK electricity retailers. The approach is designed to complement, not replace, the existing REGOs system by adding temporal granularity to certificate-based renewable energy claims.
This methodology establishes a standardised approach for temporal matching of renewable energy supply and demand in the UK market, using publicly available data sources. The methodology focuses on half-hourly matching - the finest level of temporal granularity supported by UK electricity settlement systems - to provide a physically meaningful assessment of renewable energy matching.
The primary objectives are to:
- Define a transparent, replicable methodology for calculating temporal matching scores that can be applied consistently across all UK energy retailers
- Demonstrate the feasibility of temporal matching using existing public data infrastructure, including REGOs databases, Elexon P114 settlement data, and grid mix data from the National System Energy Operator (NESO).
- Provide a framework for comparing temporal matching performance across retailers, enabling market participants to make informed decisions
- Establish a foundation for the evolution of UK renewable energy markets toward more physically-meaningful matching practices
Matched's position on renewable energy matching
- Annual matching isn't enough anymore: Matched recognises that the annualised volumetric approach was more valuable in the early stages of renewable energy development when supply was limited and any incentive for new investment was meaningful. However, as the renewable fraction of the grid has grown, the annualised approach has become increasingly deficient because it ignores the physical challenges of balancing renewable supply with demand, and incorrectly implies that demand at one time can be offset by supply at another.
- Half-hourly matching doesn't have to mean 100% matching, yet: Matched does not suggest that 100% half-hourly matching is currently feasible, or even desirable, in the near term. Research has shown that moving from 90-95% hourly matching to 100% matching incurs exceptionally high costs with existing technologies (Xu et al, 2024) . Instead, the purpose of half-hourly matching is to increase the level of transparency behind renewable claims, and to enable consumers to make more informed decisions when choosing between offers.
- REGOs remain source of truth: As the regulated framework, REGOs are the only framework that Matched can condone; we are happy to work with suppliers to explore and substantiate other foundations for claims.
- Tariff-level matching is important too: With public data alone we do not generally have visibility into the way that retailers divide volumes between their different business lines and/or tariffs so, as a result, our methodology is limited to temporal matching at the portfolio level. However, we recognise the importance of consumer choice at the level of tariffs, and we invite suppliers to share data at this level of granularity.
- We will align with the updated Scope 2 Guidance from the GHG Protocol: We recognise the ongoing debate about the role of market-based methods in carbon accounting (see, for example, the perspectives from Matthew Brander, University of Edinburgh and EnergyTag) and will follow the conclusions reached by the GHG Protocol later this year. Regardless of whether market-based methods are used for performance or inventory-based accounting, we believe our approach improves on annualised certificates.
- Our role is to provide consumers with better data: Rather than prejudge their choices, our aim is to equip consumers with the information they need to make considered decisions within their adopted framework.
Data Sources
Overview of UK Public Data Landscape
The UK energy market benefits from a relatively mature data transparency framework, with multiple public data sources providing insights into renewable generation, electricity demand, and market operations. This methodology leverages three primary data sources that collectively enable temporal matching analysis without requiring access to proprietary retailer systems: Elexon settlement data (SAA-I014), Ofgem Renewable Energy Guarantees of Origin (REGOs), and the National Energy System Operator (NESO) grid mix. We also use several small datasets to relate the various entities which comprise retailers, and a quarterly market-share report from Elexon to validate our calculations.
The public availability of these data sets represents a significant advantage for the UK market, enabling independent verification of renewable energy claims and fostering innovation in energy analytics.
Settlement Data
Elexon, as the Balancing and Settlement Code Company, administers the electricity balancing and settlement arrangements for Great Britain. This settlement data provides the foundation for understanding actual production and demand.
REGOs
REGOs are managed by Ofgem through the Renewable Electricity Register, which serves as the authoritative source for renewable electricity generation certificates in Great Britain. REGOs are a disclosure method, so are issued to all generators regardless of whether they are merchant, or supported by schemes like feed-in-tariffs, renewable obligations, or contracts for difference.
Each REGO represents one megawatt-hour (MWh) of renewable electricity generation, and details:
- The name of the generator that produced the energy, and the technology type (wind, solar, hydro, biomass, etc).
- The period of time over which the energy was produced
- The organisation that holds the certificate, and the date on which they redeemed it
Grid Mix
NESO provide comprehensive data on the electricity system's generation-mix and carbon intensity. For this methodology, the relevant part is the generation-mix which gives aggregate half-hourly generation volumes by technology type (gas, coal, nuclear, wind, solar, hydro, biomass, imports).
BSC Signatories
Elexon publishes a complete list of all signatories to the Balancing and Settlement Code](https://www.elexon.co.uk/bsc/about/elexon-key-contacts/bsc-signatories-qualified-persons/?signatory_id=all) (BSC) which, amongst other things, associates energy retailers with their BSC Party IDs.
BMU Metadata
Elexon publishes complete details of BMU metadata, including fuel-type, BSC Party, and registered capacity.
Market-Share Reports
Elexon publishes quarterly market-share reports which includes retailer’s energy volumes and number of meters under management.
Core Methodology
Methodology Overview
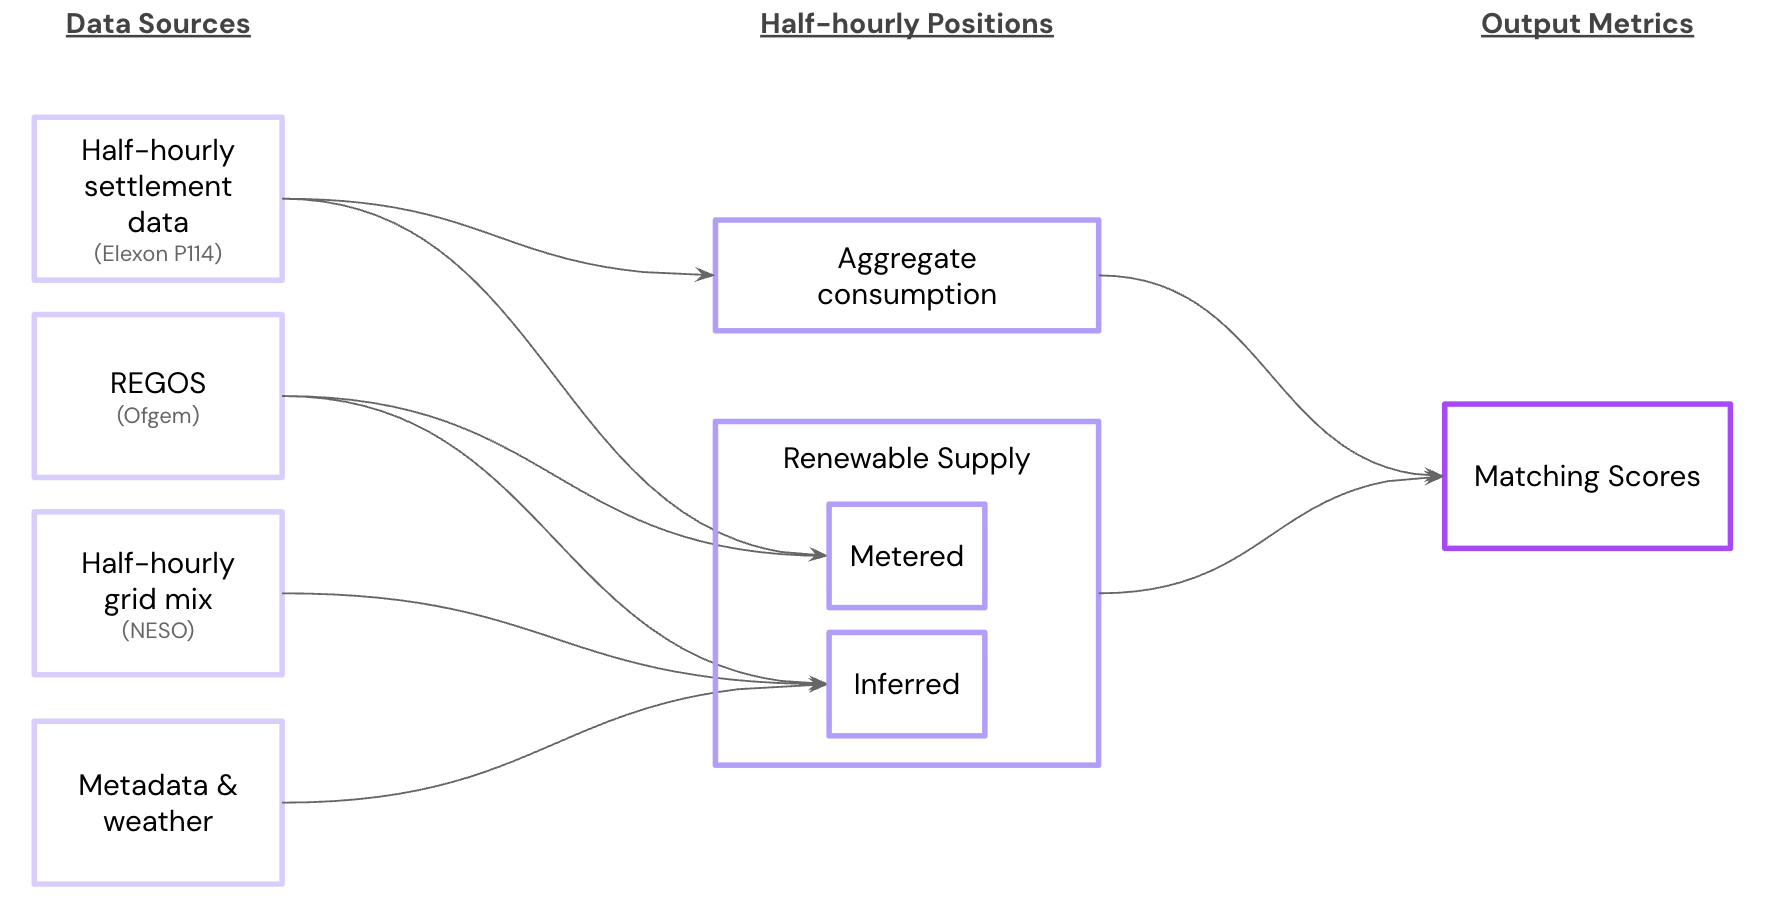
The temporal matching methodology calculates half-hourly alignment between renewable energy supply and demand using publicly available data sources. The data sources interact in the following manner:
- Ofgem's REGO database provides monthly renewable generation certificates by technology, generator, asset type, and the retailer which owns these certificates at the end of the compliance period. REGOs show what renewable energy volumes a retailer has a claim on.
- Elexon gives half-hourly settlement data by BSC Party.
- Elexon's signatories list the BSC Parties that each retailer owns: from this we can determine the half-hourly settlement data for each retailer.
- NESO supplies system-wide generation mix and embedded renewable estimates.
REGO volumes are reported monthly or annually, so we upsample to half-hourly resolution. Where it is possible to link a REGO asset to an Elexon BM Unit, we use half-hourly settlement data. Where this mapping doesn’t exist, or isn’t known, we upsample REGO volumes using the technology-specific, half-hourly grid mix data from NESO.
We can then calculate the renewable deficit at any time, which is to say the shortfall between the total load served by a retailer and the renewable power on which it has a claim. Finally, we calculate matching scores which are the fraction of demand met by renewable generation. We do this with half-hourly, monthly, and yearly temporal resolution.
Matching Framework
Temporal matching quantifies the extent to which renewable energy supply aligns with demand within each time period. Unlike volumetric matching, which allows unlimited temporal shifting of renewable attributes, temporal matching accounting mirrors the physical constraint that electricity generated in one period cannot be consumed in another.
The theoretical foundation rests on two principles:
- Temporal Coincidence: Renewable energy claims should reflect the simultaneous generation and demand of electricity within defined time periods. This approach approximates the physical reality of electricity systems where supply and demand must balance instantaneously
- Non-Bankability: Surplus renewable generation in one period cannot offset deficits in another period, unless explicitly time-shifted with storage.
For each time period t - which could be a half-hour, month, or year - we define:
- D(t) = Demand in MWh during period t
- R(t) = Renewable energy supplied in MWh during period t
- DF(t) = Renewable supply deficit in MWh = max(0, D(t) - R(t))
Matching Score Interpretation (0-1 Scale)
The matching score M(t) for each time period is calculated as the fraction of demand met by coincident supply:
M(t) = 1 - DF(t)/D(t)
When renewable supply exceeds demand, R(t) > D(t), the matching score is capped at 1.0, with surplus generation tracked separately but not bankable for use in a different time period.
This produces a score between 0 and 1 where:
- M(t) = 1: Perfect matching - renewable supply meets or exceeds demand
M(t) = 0: No matching - zero renewable supply despite positive demand
0 < M(t) < 1: Partial matching - renewable supply covers M(t) × 100% of demand
The aggregate matching score for a longer period (e.g., annual) is calculated the volume-weighted mean across all periods:
M_aggregate = 1 - ∑DF(t) / ∑D(t)
Calculating half-hourly settlement
Elexon gives half-hourly settlement volumes for all Balancing Mechanism Units (BMUs).
The process of settlement reconciliation takes a full 14 months to complete so we work with the positions that are produced in the ‘SF’ run which happens 18 working days after the settlement day. BSC Parties are billed on this run so we can presume that it is sufficiently accurate for our purposes.
Settlement volumes are adjusted for transmission losses but not for distribution losses, so we compare supply and demand at this level.
The way in which a retailer divides volumes between their different business lines and/or tariffs is not visible to us unless the divisions happen to correspond on different BSC Parties (which is rare). As a result, this methodology is limited to temporal matching at a retailer level.
We recognise the importance of consumer choice at the level of tariffs, and we invite suppliers to share data at this level of granularity.
Calculating Demand
Each retailer manages one or more BSC Parties, and we build this mapping from the list of BSC Signatories.
Each BSC Party has at least one Retailer Base BMU per Grid Supply Point (i.e. at least 14 in total across Britain). The IDs of these BMUs have the prefix “2__”.
We get the settlement data for each of a retailer’s BMUs from the S0142 files, and split the volume into two components:
- Negative BM Unit Metered Volumes: a BMU is a net-consumer when its settlement volumes are negative, which is the case for most BMUs at most times.
- Positive BM Unit Metered Volumes: some retailers have some BMUs which have positive settlement volumes, which means that they are net-generators. It is rare for the positive volumes to be significant.
We calculate retailer’s demand by aggregating all the negative settlement volumes, across all BMUs, across all BSC Parties. We invert the sign so that demand volumes are positive.
Even when settlement volumes are negative they could contain supply: for example from small generators that are independently metered but which don’t have a dedicated BMU, or from deeply embedded generators that are ‘behind the meter’. This conflation of supply causes an underestimation of demand which we address in a calibration step: see section below on “Adjusting Demand for BSC-Metered Supply’.
Calculating Renewable Supply
As the regulated requirement, we use REGOs to calculate retailers’ renewable supply. Each certificate details the generator, its technological category, the volume of energy output, and the period over which it was generated. Specifically, we take certificates that are ‘REDEEMED’.
Retailers without redeemed REGOs are necessarily assumed to have no claim on renewables.
Line Losses
Per Ofgem’s guidance we apply losses to transmission-tied generation which, in our case, we take to mean any REGO station that we can map to a BMU (below). In compliance period 2023/24 the published loss factor is 1.1050.
Monthly and Yearly Resolution
Many REGOs already have monthly fidelity. For others that have lower fidelity (e.g. annual) we evenly distribute volumes across all the months of the output period in order to get a monthly measure of supply. Yearly resolution naturally follows.
In future iterations of the methodology the monthly decomposition will account for seasonal variations in output: for example an annualised volume of 1 GWh from a wind generator would be apportioned over the months of the year relative to the contributions of the national wind fleet to the grid.
Half-hourly Resolution
We upsample REGOs to half-hourly resolution in two different ways, depending on whether the REGO stations can be mapped to BMUs or not:
BMU-Metered Generation
Generators above capacity thresholds must register as BMUs: 50 MW in England & Wales, 30 MW in South Scotland, and 10 MW in North Scotland. In these cases we match registrations of REGO generators to registrations of BMUs and respective BSC Parties.
With the following mapping process, we are able to meter over 60% of all REGO volumes.
The mapping process is a three-step process:
- Fuzzy name matching between Ofgem and Elexon names:
- Count the intersection of words, excluding common terms like “wind”, “farm”, “limited”
- Count the number of contiguous words that can be matched, in order from the start
- Metadata validation:
- Fuel type must match (e.g. wind, biomass)
- Registered capacities must match reasonably well[^1]
- Volume validation:
- Monthly REGO volumes must match monthly BMU volumes
A REGO station may be mapped to zero, one, or more BMUs. The mapping process assigns a measure of confidence to the mapping: see the appendix for a sample of this mapping.
Where REGOs can be linked to one or more generating BMUs, we use half-hourly aggregate output from S0142 files and scale accordingly. For example, if a generator produced 1 GWh in a month and a retailer holds 100 MWh of REGOs from it, we attribute 10% of the BMUs’ output to that retailer.
The appendix shows the fraction of REGO volumes that can be mapped to BMUs for each retailer.
Inferred Generation
For the 40% of REGOs that cannot be mapped to generating BMUs, we infer shapes from the half-hourly fuel mix of the grid, as published by NESO.
For example, given 100 MWh of wind in a given month, we apportion the volume over each half-hour relative to the contributions of wind to the grid at large. This preserves the temporal pattern of grid-level generation while matching the retailer's total REGO volume.
This methodology assumes that the national grid mix provides a reasonable proxy for generation patterns: see “Future Enhancements” section for ways in which future iterations of the methodology will introduce regional calibrations.
BSC-Metered Embedded Generation
A small number of retailers[^2] meter a large fraction of their generation in the same BSC Party as their load meters: this manifests as BMUs that occasionally – or even exclusively – have positive BM Unit Metered Volumes. This is most extreme for Good Energy, for whom 80% of generation is metered by their BSC Party ‘PURE’.
Future iterations of this methodology will directly incorporate these positive settlement volumes into the calculated half-hourly supply, and this will reduce the fraction of the volume for which we have to infer half-hourly shapes from grid mix. A preliminary analysis suggests that this will generally change matching scores by less than 1%.
Adjusting Demand for BSC-Metered Embedded Generation
As discussed above, some retailers aggregate some of their renewable generators in the same BSC Party as their load meters. This is generally a small fraction of the total: less than 10% of the total for most retailers.
BSC-metered embedded generation can manifest as positive BM Unit Metered Volumes: this component is easy to handle since it’s visible, and can simply be discarded.
However, more commonly, BSC-metered embedded generation is not visible and merely has the effect of reducing the negative component of the BM Unit Metered Volumes. In this case what we see is the conflation of supply and demand, which causes us to underestimate both.
This presents a challenge for our calculation of demand since we are entirely dependent on BM Unit Metered Volumes. (It is less of a problem for our calculation of supply since REGOs provide an independent foundation, and because conflated embedded generation is a small fraction of total supply).
We make the following adjustments to demand:
For Large Retailers
Elexon publishes a quarterly summary of total imports and exports, and we use this to adjust our calculation of demand for embedded generation:
- We verify that our underestimation can be explained by the retailer’s exports from embedded generation [^3]
- We calibrate demand to address the underestimation
Quarterly calibration factors are always 1 or more, and generally less than 1.1.
For Small Retailers
Small retailers are not covered by Elexon’s quarterly report so a different method of calibration is necessary.
Ecotricity, 100 Green, and Good Energy are all ‘100% renewable’ on an annual basis. For these suppliers, we necessarily work on the assumption that annual REGO volumes will closely resemble annual demand and, on this premise, scale calculated demand so that it matches annual REGO volumes. In practice we scale supply by +26% for Good Energy, +45% for 100-Green, and +0% for Ecotricity.
It looks like some retailers procure more renewable power than they consume (and, even, than is reflected by their REGOs) and we invite them to share their annual demand figures so we can accurately reflect this in our analysis.
Commentary
For both large and small retailers we add volumes by scaling the existing shape of demand. We could instead add volumes with a generation-derived shape: this would more properly reflect the fact that we’re adjusting for invisible generation.
We choose the scaling approach because it is simpler and sufficiently accurate given that calibration factors are close to 1. Furthermore, if we make the reasonable and favourable assumption that BSC-metered embedded generation is predominantly renewable, any initial underestimation of demand arises inherently from renewable matching. Consequently, matching scores are unaffected by the specific shape assigned during calibration.
Renewable Tariff Matching Scores
Several retailers offer dedicated renewable tariffs alongside standard tariffs. For these products, retailers typically commit that consumption will be matched to REGO-backed renewable supply on an annual basis. This creates a distinct matching question: when consumption is constrained to equal annual renewable supply, how well does the timing of that supply align with the timing of demand?
Scope and Applicability
Renewable tariff matching scores apply only to retailers who offer renewable tariffs and commit to 100% annual volumetric matching for those tariffs. We validate these commitments with each retailer before calculating and publishing renewable tariff scores.
Foundational Assumptions
The methodology relies on two assumptions which we validate with individual retailers before displaying the renewable tariff matching scores::
- Annual Matching Commitment: Renewable tariffs are matched 100% to renewable supply on an annual basis, meaning total REGO volumes allocated to the tariff equal or exceed total annual consumption of customers on that tariff.
- Consumption Profile Equivalence: The half-hourly consumption profile of customers on renewable tariffs mirrors that of the retailer's overall customer base. Without access to tariff-level metering data, we assume renewable tariff customers exhibit the same demand patterns as non-renewable customers.
This second assumption reflects the reality that most domestic and commercial customers' electricity usage predominantly follows predictable patterns driven by occupancy, business hours, and weather.
Consumption Scaling
Renewable tariff matching scores differ from whole-portfolio scores through a consumption adjustment that occurs before the matching calculation.
For each retailer offering renewable tariffs, we scale half-hourly consumption to align with annual renewable supply:
Scaling Factor = min(1.0, Total Annual Renewable Supply / Total Annual Consumption)
When renewable supply exceeds consumption, the scaling factor equals 1.0 and no adjustment occurs. When renewable supply falls short of consumption, we scale each half-hour's consumption. This ensures annual consumption never exceeds annual renewable supply, consistent with the 100% annual matching commitment.
The scaling preserves the temporal shape of consumption while constraining its magnitude. For a retailer with 800 GWh of renewable supply and 1,000 GWh of total consumption, each half-hour's consumption is multiplied by 0.8.
Matching Calculation
Once consumption is scaled, we apply the standard temporal matching framework. For each half-hour period:
- Renewable Deficit = max(0, Scaled Consumption - Renewable Supply)
- Matching Score = 1 - (Renewable Deficit / Scaled Consumption)
Monthly and annual scores follow from the volume-weighted aggregation of half-hourly deficits and consumption.
Limitations
Data Availability: Without tariff-level metering data, we cannot verify that renewable tariff customers actually consume electricity in the same pattern as the broader customer base. Retailers with materially different consumption profiles between tariffs may see scores that don't reflect actual performance.
Portfolio Effects: The methodology assumes renewable supply allocated to renewable tariffs follows the same temporal pattern as the retailer's overall renewable procurement. Retailers who strategically allocate specific generators to specific tariffs may achieve different matching than our scores suggest.
Validation: We work directly with individual retailers to validate the foundational assumptions before publishing renewable tariff scores. Retailers who cannot substantiate their 100% annual matching commitment, or who identify material differences in consumption patterns between tariffs, are excluded from renewable tariff scoring.
We invite retailers to share tariff-level consumption data to enable more precise calculation of these scores.
Technology Scopes
The methodology calculates matching scores for multiple technology scopes, enabling analysis under different renewable energy and carbon-free supply definitions. This reflects varying consumer preferences and the evolving understanding of what constitutes sustainable energy supply.
Filter Definitions
Four technology scopes are calculated:
- All Renewables: Wind, solar, hydro, biomass, and other renewable technologies tracked by Ofgem's REGO system.
- Renewables Excluding Biomass: As above, but excluding biomass. Some consumers choose not to include biomass in their renewable energy definition.
- With Nuclear: All renewables (including biomass) plus nuclear power, representing a carbon-free supply mix.
- With Nuclear Excluding Biomass: Wind, solar, hydro, other renewables, and nuclear, excluding biomass.
Nuclear and Carbon-Free Matching
While nuclear power is not classified as renewable energy under UK regulations, it is a low-carbon generation source. The methodology incorporates nuclear supply to enable carbon-free matching analysis alongside traditional renewable-only metrics.
Data Source
Nuclear supply data is sourced from retailer Fuel Mix Disclosures (FMD), required by Ofgem. Unlike renewable generation which is tracked through the REGO system, nuclear supply is based on declarations of generation.
Calculating Nuclear Supply
Nuclear supply volumes are calculated from the FMD nuclear percentage and the retailer's total consumption:
Annual Nuclear Supply (MWh) = Total Annual Consumption (MWh) × Nuclear FMD Percentage
Temporal Distribution
For half-hourly and monthly matching calculations, we distribute the annual nuclear supply proportionally to system volumes, as reported by NESO.
For time period t:
Nuclear Supply(t) = Annual Nuclear Supply x System Nuclear(t) / System Annual Nuclear
Carbon-Free Matching Scores
When nuclear supply is included in matching calculations (via "with_nuclear" or "with_nuclear_no_biomass" scopes), the resulting scores represent carbon-free matching rather than renewable matching. These scores quantify the temporal alignment between low-carbon supply (renewables + nuclear) and consumption.
Limitations
Whereas suppliers contract with individual generators, we shape half-hourly and monthly volumes against system volumes. This causes us to underestimate the fluctuations in a suppliers' contracted volume - e.g. from planned maintenance at a particular generator - which causes an overestimation of matching scores.
Output Metrics and Interpretation
The methodology produces several key outputs:
- Half-hourly Consumption and Supply: From which we can show half-hourly surplus and deficit of renewable supply.
- Half-Hourly Matching Scores: The fundamental metric showing renewable matching performance for each 30-minute period, calculated for all four technology scopes (all renewables, renewables excluding biomass, with nuclear, with nuclear excluding biomass). Renewable tariff matching scores are also calculated when (i) a supplier has renewable tariffs and (ii) has worked with Matched to validate the assumptions detailed in the "Renewable Tariff Matching Scores" section above.
- Monthly and Compliance-Period Matching Scores: Importantly, the annual aggregate scores can be used to validate the methodology through a comparison with each retailer's annual Fuel Mix Disclosure.
- Technology Mix: Breakdown of matching performance by renewable technology type.
These metrics allow:
- Retailers to understand and improve their temporal matching performance
- Energy buyers to compare retailers based on physical renewable delivery, with a higher level of fidelity than what is provided by existing Fuel Mix Disclosure reports.
- Regulators to assess market evolution toward temporal matching
- Researchers to identify opportunities for system optimization
Worked Example
We exemplify our methodology by providing a worked example for Bryt Energy in compliance period #22 (year ending 1st April 2024). We choose Bryt because in this period they are the best-performing supplier that is large enough to be covered by Elexon’s quarterly market share report. Supporting data is provided alongside this document.
Half-hourly Settlement
Bryt Energy trades as BSC Party ’BULLION’, comprising 14 retailer base BMUs - one for each of the UK’s regional Grid Supply Point. We extract the half-hourly settlement volumes for each BMU from the S0142 files for each day of the compliance period.
Consumption
The settlement volumes for all of Bryt’s BMUs are always negative, meaning that they are always net-consumers. The total consumption of all Bryt Energy’s customers is the aggregate of settlement volumes over all BMUs.
We aggregate consumption to the quarterly level and compare with the volumes published in Elexon’s market-share report and, in this case, the volumes match precisely: this is consistent with the fact that there is no observable metered supply within BULLION.
The total consumption over the compliance period is 3.5 TWh.
Renewable Supply
Bryt Energy trades REGO certificates as Bryt Energy Limited. Their total volume over the compliance period is 3.8 TWh.
Supply is from 197 REGO generators, of which 12 can be mapped to BMUs. The BMU-metered supply constitutes 35% of Bryt Energy’s total volume: this is about half that of other retailers, probably because Bryt Energy seems to prefer exclusive offtakes from small assets.
For the remaining 65% of non-BMU-metered supply, we apply technology-specific half-hourly shapes from the grid at large.
Renewable Surplus and Deficit
We can now compare supply and demand, and calculate the renewable surplus and deficit.
Matching Scores
We calculate matching scores by aggregating consumption & deficit at half-hourly, monthly, and yearly levels and applying the formulas described in ‘Matching Framework’.
The scores are: 82% (half-hourly), 95% (monthly), and 100% (yearly).
Key Findings
Application of this methodology reveals significant gaps between annual certificate matching and temporal renewable delivery in compliance period #22 (year ending 1st April 2024). The analysis of 15 major UK energy retailers shows:
- Wide Range of Temporal Matching Performance
- Half-hourly matching scores range from 0% to 89% across retailers
- Monthly matching scores show similar variation, from 11% to 95%
- This contrasts sharply with annual volumetric matching, where many retailers claim 100% renewable
- Performance Clusters
- Leading retailers (Good Energy, Octopus, Bryt Energy) achieve 80-90% half-hourly matching
- Mid-tier retailers (Squeaky Clean, Ecotricity, So Energy, SSE, EON Next) maintain 60-75% half-hourly matching
- Other retailers (British Gas, EDF, Scottish Power, OVO) show significantly lower matching at 11-21%
- Temporal Granularity Impact
- The gap between half-hourly and monthly matching scores reveals the importance of sub-monthly temporal alignment
- For example, Bryt Energy shows a 13 percentage point difference between half-hourly (82%) and monthly (95%) matching
- This suggests significant daily and weekly variations in renewable supply alignment
Implications
The findings have significant implications for market participants, policymakers, and consumers:
- Consumer Choice and Transparency
- Current annual matching claims mask substantial differences in actual renewable delivery
- Consumers can now make more informed choices based on physical renewable performance
- The methodology enables comparison of retailers beyond simple "100% renewable" claims
- Market Evolution
- The wide range of matching scores creates opportunities for leading retailers to differentiate on the quality of power delivered
- Leading retailers demonstrate that high temporal matching is achievable with current market structures
- The methodology provides a foundation for market evolution toward time-matched renewable procurement
- Policy and Regulation
- Current regulatory frameworks may need updating to reflect temporal matching capabilities
- The methodology offers a practical approach for evolving disclosure requirements
- Policymakers can use these insights to design incentives for improved temporal matching
- System Optimization
- The significant gaps between half-hourly and monthly matching highlight opportunities for system optimization
- Retailers can use these insights to improve their renewable procurement strategies
- The methodology provides a framework for identifying and addressing temporal mismatches
Future Improvements
The temporal matching methodology will evolve as data availability improves and market needs develop. Planned enhancements focus on increasing accuracy, expanding coverage, and improving usability for market participants.
REGO Monthly Upsampling
As discussed above, REGOs with multi-month output periods should be decomposed into monthly volumes with a weighting that reflects grid conditions. For example, an annualised volume of 1 GWh from a wind generator should not be apportioned evenly over the months of the year but, instead, with a weighting that reflects the monthly contributions of wind to the grid at large.
Enhanced Inference of Half-Hourly Shapes
For generators not metered as BMUs, we currently infer technology-specific half-hourly profiles from the overall grid mix. This can be improved by first removing all known metered volumes, leaving a residual shape that better reflects generation not metered at the BMU level. For example, removing metered wind volumes (primarily offshore) would yield a more accurate estimate of unmetered wind generation (primarily onshore).
Other potential improvements include:
- Using NESO’s embedded generation forecasts to shape non-metered supply.
- Incorporating regional shapes from MPAN-level data (e.g. via ElectraLink) to refine generation profiles. Moving to a regional grid mix would better capture the effects of local weather patterns.
BSC-Metered Embedded Generation
When a substantial number of generators are metered by the same BSC Party that manages load meters, BMUs can have positive BM Unit Metered Volumes. We can directly incorporate this positive component into our calculation of a retailer's renewable supply.
Storage
The REGO system doesn’t cover storage, but our methodology could be extended to reflect the time-shifting benefits of batteries and pumped hydro.
Footnotes
[^1]: We assign a high confidence (p-value = 0.1) for a power ratio between 0.95 and 1.05.
[^2]: Good Energy, 100 Green, Ecotricity, SmartestEnergy
[^3]: More precisely, we expect our underestimation in demand to be elexon_exports - visible_bsc_metered_generation where the latter is the aggregation of all positive BM Unit Metered volumes (and generally very small).